MetricsHub
MetricsHub 0.9.06
- Introduction Overview Connectors Directory
- Installation Overview On Debian Linux On Docker On Red Hat Enteprise Linux On Windows
- Configuration Monitoring Configuration Sending Telemetry Password Encryption
- Guides Quick Start - Windows Quick Start - Linux Sustainability Health Check (Enterprise Edition) Debugging MetricsHub CLI (
metricshub)
Overview
MetricsHub® is a universal metrics collection solution for OpenTelemetry[1] which extracts metrics from any local or remote resource - such as a host, service, or application - and pushes the collected data to any observability back-end supporting OpenTelemetry like Prometheus, New Relic, ServiceNow, and Splunk.
Operating Principle
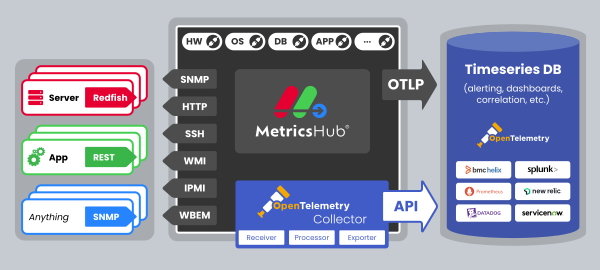
MetricsHub acts as an agent within the infrastructure. It pulls data from systems and applications using various protocols like SNMP, WMI, REST APIs, or SSH.

MetricsHub includes a library of YAML files - called connectors - which describe how to collect metrics about operating systems and a variety of platforms.[2]
MetricsHub uses the OTLP protocol to send metrics to observability platforms that support OpenTelemetry natively like Datadog, New Relic, Prometheus, and Splunk.
Because it is recommended to use an OpenTelemetry Collector in a production environment, MetricsHub Enterprise is bundled with OpenTelemetry Collector Contrib to facilitate connections to over 30 different observability platforms[3].
Monitoring Coverage
MetricsHub Enterprise provides out-of-the box support for hundreds of servers, storage systems, network devices, and databases[2] through its built-in library of connectors.
Fully customizable, MetricsHub can also be configured to cover new use cases in no time, such as the monitoring of systems or applications not covered out-of-the-box through protocols like HTTP, IPMI, PING, SNMP, SSH, WBEM, WinRM or WMI.
Main Features
- Remote Monitoring: Gathers metrics from remote systems using various protocols like
HTTP,IPMI,PING,SNMP,SSH,WBEM,WinRMorWMI. - OpenTelemetry native: Pulls metrics from diverse systems and applications while strictly adhering to OpenTelemetry's semantic conventions.
- Out-of-the-box support for 200+ systems and apps.
- Extensible: Adds support for new systems, platforms, or applications with just a few lines of YAML.

